

The Giving Bridge
A Lookback at 2023 Trends in Global Generosity

Table of Contents
II Letter From Our Chief Data Officer
III GivingTuesday’s Datasets and Definitions
IV Generosity & Depolarization
Generosity Acts as a Bridge Between People and Communities
Giving Across the Divide
V The Global Giving Ecosystem: Following the Money
Over 1.5 Trillion Dollars Given Annually
Overall Monetary Giving
Global Monetary Recipients
Global Monetary Giving to Nonprofits
Nonprofit Donor Acquisition & Retention in the USA
Donor Motivation & Trust
Optimizing Solicitation: Who to Ask and How Often to Ask Them?
Givers Are Ready to Give More
What Our Findings Mean for Nonprofit Audiences
VI Beyond Money: How We Show Up for Each Other
Giving in Multiple Ways
Volunteering Around The World
What Does this Mean for Nonprofit Audiences
At the GivingTuesday Data Commons
VII Appendix
Executive Summary
Welcome to the GivingTuesday Data Commons’ 2023 Lookback Report, our 4th annual report on global giving trends.
The GivingTuesday Data Commons investigates the nature of generosity globally using quantitative and qualitative methods. Our mission is to generate insights and new knowledge that can help create a more effective and evidence-driven social sector, capable of meeting the moment.
Last fall, we published our first research agenda to guide our work.
In our 2021 Lookback Report, titled From Scarcity to Abundance: Mapping the Giving Ecosystem, we showed that, contrary to accepted wisdom in the nonprofit sector, the giving ecosystem is characterized by abundance, with the overwhelming majority of people actively participating in it through prolific and diverse acts of generosity.
In our 2022 Lookback Report, Rethinking Resilience, we shared data demonstrating that the current understanding of our ‘philanthropic sector’ is too narrow and exclusive, limiting the impact and sustainability of social sector organizations dependent on public generosity. Based on our findings, we advised nonprofits to move beyond outdated transactional models and to explore more diverse, distributed, responsive, and enduring relational strategies to improve resilience and impact.
In this 2023 Lookback Report, we continue to present new insights and concrete recommendations derived from global giving data and map the giving ecosystem in all its richness and complexity. And our findings continue to point in the same, exciting directions.
This year, we’re presenting a larger set of holistic questions, and showcasing more granular data that we’ve curated against other data sources from around the world.
Among our key findings this year:

Amidst global worries about increasing polarization and diminishing social cohesion, we see evidence of people’s willingness to give across boundaries of ideology, lifestyle, and community.
Despite philanthropic pessimism resulting from downward donor trends in money raised and participation rates, most people remain open and ready to help those most in need. In other words, the giving ecosystem is as robust as ever, and it appears increasingly clear that it is nonprofits who must adapt and redesign their relationship with givers to overcome the steady declines in donors and dollars.
We think that one reason for the decline in giving to charities and nonprofits is that the social sector as a whole is not inviting enough different kinds of people into its support ecosystem, whether as donors, volunteers, or advocates. This has profound implications on organizational resilience, as well as on questions of equity and inclusion, as the prioritization of pursuing money from those with wealth has excluded many others from shaping the priorities and practices of the social sector.

Letter From Our Chief Data Officer
At the GivingTuesday Data Commons, we use data to identify evidence-based insights that enable nonprofits around the world to successfully engage with the giving ecosystem, and to maximize their social impact. This means being as rigorous as possible in our data sourcing and analysis so that we can confidently stand behind the claims we make. In other words, you won’t find much speculation or anecdotal evidence in this report.
Except right here, in this introductory letter, in which I’m taking the liberty of riffing a little. You’ll see our detailed findings and recommendations in the following report, but here’s the picture I see emerging and some of the key opportunities and questions it suggests.
Let’s start with a familiar problem: dollars from large donors have declined over the past two years, a risk we flagged in 2021. This appears to be having the effect of driving nonprofits to double down on this segment to compete for a shrinking pie, exacerbating the situation. We have to break that cycle and diversify, if we’re going to have a resilient sector.
Fortunately, we’re beginning to trace the outlines of a transformative new understanding of giving, one that will offer nonprofits a new model for sustainably increasing their impact.
I say beginning because the global giving ecosystem is massive and complex, and we’ve only begun to understand it holistically. On the contrary, the social sector has always operated in silos – organizational, professional, geographical, technical, theoretical, cultural, and more – that have limited our perception of the true scope and impact of giving behaviors; not just on organizations, but on individuals, families, communities, and cultures.
I think the great opportunity of the future lies in tearing down those silos, and in understanding that generosity isn’t just a “nice thing”, but a vital component of a thriving civil society.
We need to move beyond transactional models that see giving as an elusive target defined by money, towards a relational understanding of the giving occurring all around us. Because as our data show, the reality is that giving is not scarce prey that we must compete for and pounce upon, but rather a continuum of inspirational acts of generosity, large and small, that collectively create and nurture healthy relationships all around us, every day. That continuum already shapes much of our lives – for human beings are inherently generous – but it also can be strategically cultivated, amplified, and enriched to increase our organizational impact for good.
How? By inviting more people in. By making everyone feel welcome. By giving more people opportunities to contribute. By reorienting our relationship with supporters around being partners with generous communities, rather than the focal point of our institutional view of generosity. By leveraging storytelling and technology in deep ways. By breaking down organizational silos between Development and Communications and Community Engagement teams. These old-school silos are no longer efficient or effective. Motivation and participation and impact aren’t generated by top-down, transactional methods, but by distributed storytelling, by activated networks, and by dedicated friends who feel genuinely seen and heard, and who actively enjoy giving in many different ways.
“Through the work of GivingTuesday’s Data Commons and Global Hubs, we’re learning more about how and why generosity is a crucial mechanism for well-being in individuals and communities around the world. I’m particularly fascinated by the data we’re gathering showing people’s willingness to help each other across boundaries of identity, politics, beliefs, and geography, because it will allow us to better nurture and inspire those actions and offers an antidote to polarization. With increasing levels of isolation, mistrust, and volatility, we need a strong and resilient civil society, one that understands how to use data to foster people’s generous spirit, now more than ever.”
I do understand that experimentation and disruption are risky and can be costly. I know that many nonprofits are under financial strain, and that this is the toughest time to take risks, but I also know it’s crucial for our shared future. That’s why we’re working with more partners: to understand the needs of local organizations, to help support new research and testing opportunities, and to create useful bridges between our data assets and local initiatives. And that’s also why I want to challenge funders (private or public) to step forward with significant financial support for smaller nonprofits that are prepared today to radically revamp outdated organizational structures and offerings.

The more we understand that the act of giving isn’t just the result of community and caring but that it actually creates those things, the more successful we will be in cultivating a healthier giving ecosystem, and a healthier world.
Woodrow Rosenbaum
Chief Data Officer
GivingTuesday’s Datasets and Definitions
Datasets
This report reflects the integration of a number of datasets into our Data Commons, as well as our review of the wealth of research published this year from a growing community of stakeholders interested in supporting and understanding the context in which generosity emerges around the world. Please visit each link to learn more about each dataset and to request access to the data or our dashboards.
2023 Global Omnibus Survey - Global Omnibus Survey investigates global generosity trends through a questionnaire tailored to a global audience in seven countries: USA, Canada, Great Britain, Mexico, Brazil, Kenya, and India. The main objective of this survey is to profile the giving behaviors of typical donors from different countries. This survey is a modified version of the GivingPulse questionnaires, where both use the same generosity taxonomy. It is an online survey of 1,000 people for each country. Respondents are weighted differently for each country, with typical weighting profiles factoring in age, income, and education. This year’s Lookback Report relies heavily on this dataset, specifically to report on global behaviors in different countries. The data of the Global Omnibus Survey can be accessed via the GivingTuesday Data Commons platform.
Fundraising Effectiveness Project, with the Association of Fundraising Professionals - In line with GivingTuesday’s collaborative model, the Fundraising Effectiveness Project (FEP) is a collaboration among fundraising data providers, researchers, analysts, associations, and consultants to empower the sector to track and evaluate trends in giving and to accurately map the state of the industry on a quarterly basis. The FEP contains transaction-level fundraising data with more than 500 million transactions that are continuously updated by fundraising software partners.
By enabling the sector to accurately benchmark itself against the most recent trends, the FEP report helps nonprofit organizations to benchmark and improve fundraising practices, data platforms to better serve their user base, and policymakers to make more informed decisions. Analyzed quarterly by the GivingTuesday Data Commons, this project offers a unique view of the current year’s fundraising data in aggregate to provide the most recent trends for guiding nonprofit fundraising and donor engagement. The reports have become one of the most widely viewed publications in the sector. It also provides a centralized repository of existing fundraising data, which enables the potential growth in the sector by doing research, providing partners with access to aggregated data to help them engage in research projects, and disseminating the knowledge gained in such research.
GivingTuesday’s GivingPulse - Since 2022, with the support of the Fidelity Charitable Catalyst Fund, the GivingTuesday Data Commons collects weekly data, through the GivingPulse survey, on the attitudes and behaviors of Americans, painting an accurate, up-to-date, evidence-based portrait of giving in America at any given time. This is a cross-sectional, online survey of a sample of 100 American adults weekly, aged between 18 and 85 years and who have lived in the USA for at least 12 months, aggregated monthly. This survey encompasses the diverse set of behaviors that people engage in to support others including financial and material donations, volunteering, advocacy, and mutual aid. GivingPulse is a key data source for this 2023 Lookback Report highlighting giving behaviors in the USA within the past year. The raw data of the GivingPulse survey and its data exploratory tool can be accessed here.

Definitions
Giving Types - In this report, we provide data that captures a range of giving behaviors. These behaviors have been organized into 4 categories that we call Giving Types:
Money - any gift of money to an individual or organization outside of family
Time - all forms and contexts of voluntary giving of time to an individual or organization outside of family
Items - any gift of a material object — such as food, clothing, personal products, or furniture — to an individual or organization outside of family
Advocacy - any proactive advocacy, public endorsement, or promotion of a cause
For improved legibility, we sometimes refer to Giving Types as ‘types of giving’ or ‘ways of giving.’
Recipient Groups - In this report, we also provide data that captures giving to a range of recipients. These recipients havebeen organized into 3 categories that we call Recipient Groups:
Registered Organizations - legally registered charitable or nonprofit organizations
Structured Organizations - organized and structured community groups, associations, clubs, etc. that are not legally registered entities
Unstructured Giving - unstructured community groups and individuals
Formal Giving means donations to Registered Organizations only.
Informal Giving means donations to either Structured Organizations or Unstructured Giving.
Generosity & Depolarization
Generosity Acts as a Bridge Between People and Communities
In these increasingly polarized times, we have begun gathering evidence about people’s willingness to help others whose values or lifestyles they disagree with.
What we have discovered is that in the social sphere most of us are willing to look beyond these disagreements to find a human connection rooted in respect, caring, and – above all – generosity. In this section, we shine a light on the dynamics of giving across political and social divides and demonstrate how giving can and often does serve as a bridge connecting diverse populations and communities.
Giving Across the Divide
Anecdotally, we’ve heard from many voices in the social sector concerned about the impact of polarization on people’s willingness to support the work of particular causes, issues, and communities. We thought this was an important line of inquiry to build into our survey tools. In this year’s Global Omnibus Survey, we asked respondents in 7 countries (Brazil, Canada, India, Kenya, Mexico, Great Britain, USA) to agree or disagree with 3 statements concerning giving and polarization:
I help others, even people whose beliefs, politics, or lifestyle I don’t agree with.
I strive to help those most in need, even if that means helping those from my community less.
If everyone just supported the needy within their own communities, there would be far less poverty around the world.
We sorted respondents into 3 groups:
The Least Polarized group consists of those who agreed with both questions a. and b. They self-identify as willing to help others regardless of their beliefs or community affiliation.
The third Medium Polarized group is defined as anyone not in the least or most polarized group.
The Most Polarized group is made up of respondents who disagreed with both a. and b. They self-identify as unwilling to help others who differ in their beliefs or community affiliation.

We used these groupings as a lens through which to examine how greater and lesser degrees of polarization intersects with different giving behaviors, which revealed a number of interesting insights:
The largest group in every country is the ‘least polarized’ group. Canada (43%), Great Britain (40%), and Mexico (48%) are the countries where less than half of the population is in the least polarized group. Kenya has the largest least polarized group, containing 81% of Kenyan respondents. Meanwhile, the smallest group in every country surveyed is the ‘most polarized’ group. This finding suggests that there exists a “giving bridge” that reaches across people’s views of other groups in society.

In each of the countries we surveyed, the impact of polarization on people’s attitudes towards giving appears to be significantly less than we expected. In our data, we see that a plurality of people around the world are willing to give across various boundaries, despite divisive narratives that emphasize perceived differences between us.

Yet we do see some consistency in the data across several lines of questioning. Perhaps unsurprisingly, people in the “least polarized” group tend to give more overall. This aligns with the fact that Kenya, India and Brazil – countries with the greatest percentage of respondents in the ‘least polarized’ group – are also the countries in which the percentage of people who give is greatest, as we examined in detail in our 2022 Lookback Report.
We might assume from this finding that these people give more because they are less polarized, that is to say that they are more compassionate and open-minded people, therefore they give more diversely. But is it possible that they are more compassionate and open-minded precisely because they give more? Causality could go either way, or both.
In our Giving Pulse survey, people who self-identify as “compassionate” are not any more or less generous than others. Moreover, the most generous people are more likely to agree with some polarizing statements (e.g. “A decline in the share of Americans belonging to organized religion is bad for society”) and also more likely to agree with other inclusive, depolarizing statements, such as “compromise is how things get done in politics.”
Nevertheless, for those of us in the USA, the evidence that more polarization in society is associated with reduced giving should alarm us. This is further supported by a 2023 survey published by the American Immigrant Council about “belonging” in America. A sense of belonging is related to less polarization, and that study found that the people who don’t feel like they belong in their communities are less likely to get involved in civic activities, such as volunteering or donating to nonprofits. Currently, 74% of Americans feel that they don’t belong, or have ambiguous feelings about their place in the community. We plan to delve further into the relationship between generosity, prosocial behavior, polarization, trust, and belonging in the coming year.

They are also more likely to report taking input from family and friends when deciding whom to help. Correspondingly, the most polarized group is less likely to exhibit these attitudes. One conclusion that nonprofits might draw is that they play an important role in reducing polarization – it might also be in their longer term financial benefit.
Our survey also found that people tend to report financial strain at the same rates across the polarization spectrum. In Kenya, India, Brazil, and Mexico, the proportion of respondents reporting financial strain from giving increases as polarization decreases, i.e. financial strain is more commonly reported by the least polarized group. In the USA, Great Britain, and Canada, a respondent’s level of polarization is not strongly associated with their self-reported level of financial strain from giving.
We also found that across the board, the least polarized respondents are more likely to feel that everyone has a responsibility to give to those in need, and they are more likely to trust nonprofit organizations.
The Global Giving Ecosystem:
Following the Money
We have been making the case that the global giving ecosystem is multi-faceted, and that its civic impact can and should be measured in many more ways than just the donation of dollars. Yet there’s no denying that individual financial giving is an important component of the Giving Bridge. But how important? And just how big is it?
We think developing this understanding is important, but we’re working with imperfect data and models. In the coming years, we’ll be refining our answers to this question with new research and data initiatives.
However, what we do know now is that when it comes to supporting people in communities, a myriad of individuals, formal and informal organizations, and governments contribute financially to the giving sector. By tracking, extrapolating, and aggregating reliable data in each of the key areas of global financial giving below, we have at least begun to credibly trace the shape and size of the financial dimension of the global giving ecosystem.

Over 1.5 Trillion Dollars Given Annually
As the figure to the left shows, a vast amount of money is donated by and to individuals and communities every year.
In fact, the best available evidence indicates that the total amount given annually surpasses 1.5 trillion dollars.
We think this estimate likely vastly undercounts the true overall value of the global nonprofit sector, as we are only tracking flows of money given with data available. Other measures of the size of the nonprofit economy indicate that nonprofit organizations are spending much larger amounts of money on programs and services as well as on sustaining their operations.
We encourage interested observers to read our technical documentation of our estimate in the Appendix and tell us what we are missing.
We (and others) think most of the money given to people around the world comes in the form of remittances (someone works in one country and sends money back to a home country to help the family and community). This is mostly a black box, as the companies that transfer these funds do not share their data, but a few agencies (including the World Bank and the International Monetary Fund) do track this financial flow. In reviewing the available data, we estimate that global remittances in 2023 amounted to 860 billion dollars.

Remittances contribute a significant amount to many economies in the Global South, representing 5%+ of GDP in 53 countries last year, according to the World Bank KNOMAD Migration and Development’s Brief 37. Nearly all of this money is sent by individuals to other individuals, who spread the money in their communities (through commerce but also some gifting), making it effectively the largest form of "bottom-up" philanthropy. While the majority of this money likely serves families of diaspora and their communities, an unknown portion of remittances may not be intended to support giving, per se. So, with that in mind, the "generosity" portion is far less than $860 billion, but still likely a significant part of the philanthropic whole.
The next largest tranche of money is direct donations from individuals to organizations (about half a trillion worldwide), followed by aid from governments, mostly to other governments that pass it through their agencies. Religious giving is included with individual donations. Smaller than any of these are funds from foundations and donor advised funds, that combine for $122 billion annually.
We could not find a worldwide estimate for donations from individuals to organizations in their communities, so we created our own model from available sources and estimated that this amounted to $192 billion annually, excluding the US, or a total of $512 billion (see Appendix for methods).
Project Snapshot
India’s GivingTuesday Data Commons
2023 saw the launch of the India Chapter of the GivingTuesday Data Commons (GTDC). The inaugural convening took place in Delhi, with 12 partners in attendance to set objectives, values, and establish the collaborative ethos of the collective. This illustrious set of partners includes academic centres (Centre for Social Impact and Philanthropy), consulting organisations (Sattva Consulting), intermediaries (Atma, Blue Ribbon Movement, One Stage (CAF India)), implementing organisations (Bhumi, Pratham Education Foundation), networks (ComMutiny), funders (ATE Chandra Foundation and Rohini Nilekani Philanthropies), and technology partners (Ooloi Labs and GTDC).
GTDC India’s first project is a unique collaborative research study, titled ‘UDARTA: Everyday Giving in India’, that will provide nonprofits in India with actionable insights to strengthen their stewardship of individual givers. The study aims to explore the potential of everyday giving, analyse current fundraising and volunteer management practices, and understand individual giver preferences. The study is currently in its design and pilot phase, and will go into data collection and analysis in the second half of 2024.
As with all GivingTuesday Data Commons projects, the overall goal is to strengthen the social sector and expand its pool of resources. Therefore the final outcome of the study will be bespoke data, actionable insights, training and support to nonprofits to strengthen their organisational capacity to grow individual giving in all forms.
This is the first of a developing pipeline of upcoming studies specifically designed for the Indian context.

Overall Monetary Giving
In most places we looked, we saw declines or negligible increases in overall monetary giving (including formal and informal recipients) in 2023. Our own Global Omnibus Survey found that:
No country saw substantial YOY increases in overall monetary donation.
Overall monetary giving rates were in decline in 2023 in Brazil (-5%) and Canada (-6%), with a small decrease observed in Great Britain (-3%). The Canadian decline represents the 11th straight year of declining donations according to CanadaHelps despite demand for social sector support being at its highest ever.
A slight increase was observed in Mexico (+3%), while India, Kenya, the US, and Great Britain saw minimal changes to monetary giving in general.
Global Monetary Recipients
Again, drawing from our Global Omnibus Survey, we asked questions about what kinds of entities are receiving people’s monetary support.
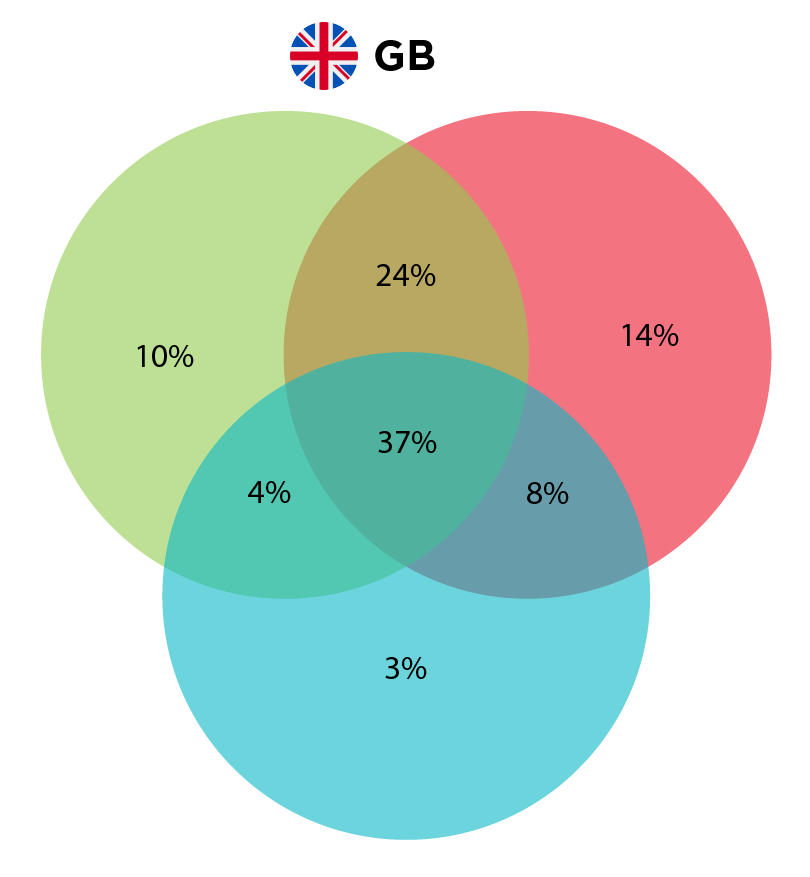
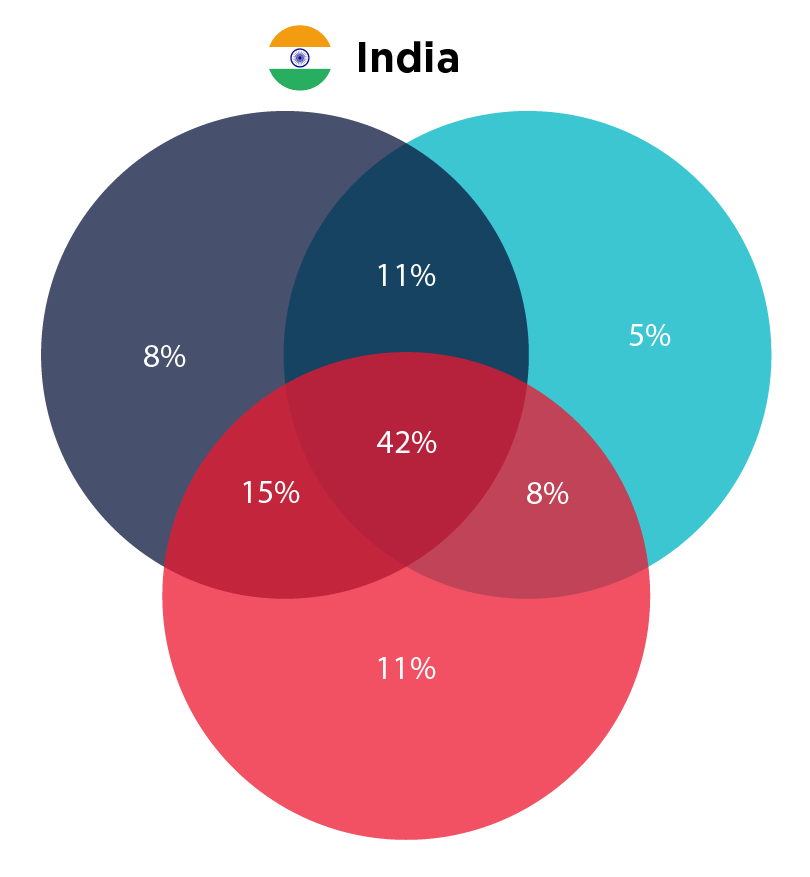
Donations of dollars can be separated into donations made to formal organizations (ie. charities and registered nonprofits) and those made informally (ie. to informal organizations and individuals). Although most people who give money give to both formal and informal recipient groups, our Global Omnibus Survey results show how different countries favour different combinations of recipient groups.
Like last year, globally, most people who give do so both formally and informally. Giving directly to a person in need is the most popular method in every country except Great Britain. Online direct to an organization and in person at a live event or religious service were also among the top methods overall.
The US (19%), Great Britain (30%), and Canada (35%) have the largest subgroup of respondents giving ONLY to registered organizations.
In India, Kenya, Mexico, and Great Britain, there have been shifts away from giving only informally in 2023 (-3% India, -14% Kenya, -8% Mexico, -6% Great Britain). This shift mostly corresponded to an increase in people giving both formally and informally (+12% Kenya, +10% Mexico, +6% Great Britain). In India, the shift was mostly towards formal-only giving (+2%).
The US saw the largest drop in formal-only giving (-5%) in 2023, with increases in giving informally only (+3%) and both formally and informally (+2%).
The breakdown of formal and informal giving in Brazil and Canada remained minimally changed compared with 2022.

In Kenya and Mexico, people most often give money directly to individuals in need. In India and Brazil, people give at similar rates to individuals and registered nonprofits. In Great Britain, the US, and Canada, people give more often to registered nonprofits. The margin between formal and informal giving being largest in Great Britain 44% for registered nonprofits, 23-25% to informal groups or individuals.
Global Monetary Giving to Nonprofits
Looking specifically at giving to formal registered nonprofits, we see a mixed bag globally regarding participation rates, compared to what we observed in last year’s figures.
Brazil and Canada¹ saw decreases in the numbers of people saying they make monetary donations to registered nonprofits YOY (-4% Brazil, -5% Canada).
Despite limited changes in overall donation rate in Mexico and Kenya, both countries saw increases in self-reported monetary donations to registered nonprofits (54% -> 68% in Kenya, 21% -> 24% in Mexico). We cannot at present account for the sudden increase in Kenya.
The proportion of respondents saying they are donating to registered nonprofits remained stable in India, the US, and Great Britain.
In Canada, the number of people reporting giving to nonprofits among monetary donors has been trending steadily downwards.
In India and Mexico, self-reported giving to nonprofits among monetary donors has been trending upwards overall since 2021.
¹CanadaHelps 2024 Giving Report also saw declines rates of Canadians giving charitable donations, as measured by tax filings and survey data.
Project Snapshot
GivingPulse
Through this pivotal project, GivingTuesday is actively seeking to understand and share insights into the nature of generosity in all its forms and to expand the collaborative research environment in the social sector. GivingPulse is designed to allow the social sector to explore how various events, interventions, crises, and demographic factors pact or correlate with generosity in near real-time.

The GivingTuesday data science team’s work on this project includes developing, validating, implementing, and iterating the weekly survey on a quarterly basis as well as building out pipelines that automatically produce and update dashboards and reports every quarter. The outputs from this work, namely the raw and structured GivingPulse data, summary tables and an interactive data visualization dashboard, are readily available through the GivingTuesday Data Commons platform on a weekly basis to anyone eager to learn about generosity trends in America. We anticipate deploying the GivingPulse model internationally through our regional Hubs and national GivingTuesday partnerships in the near future.


Nonprofit Donor Acquisition & Retention in the USA
Despite the relatively stable trends in our survey data from across the world, we see some troubling trends continuing in the U.S., where we are able to compare survey data with transaction-level data through the Fundraising Effectiveness Project (FEP), a collaboration with the Association of Fundraising Professionals, which tracks online giving to formal nonprofits. We are working with our Global Hubs to support the development of data initiatives relevant to national and regional philanthropic interests.

As indicated in the following figures, US nonprofits generally saw continuing significant declines in donor participation, continuing a worrying trend.
The only increase in donors was in new donors (2.3%), the first such increase since 2021 and an encouraging light in an otherwise grim picture.
Looking at donor retention, FEP data shows a continuing decline in the ability of American nonprofits to retain donors, with a drop in retention of 3.5% last year.


Project Snapshot
Donor Advised Fund Research Collaborative
GivingTuesday Data Commons supported the Donor Advised Fund Research Collaborative (DAFRC) in their research to increase public understanding of donor advised funds (DAFs). The DAFRC contributes to the public understanding of DAFs by collecting the most recent data on DAF accounts and analyzing their characteristics and giving behavior. Among the project’s main goals is to collect and analyze account-level DAF information that is not available in public data sources, like the IRS Form 990. GivingTuesday collaborated with DAFRC as its data storage and analytics partner.
The most recent research, the 2024 National Study on Donor Advised Funds, published in February 2024, is the most comprehensive independent research on DAFs to date. In the US, DAFs continue to increase in popularity among donors and in importance in the philanthropic sector. According to the 2023 DAF Report by the National Philanthropic Trust, in 2022, there were nearly 2 million DAF accounts that received close to $86 billion in contributions from their holders, gave out about $52 billion in grants to the nonprofit sector, and had about $229 billion in assets in their accounts at the end of the year. Although DAFs are still considered a young philanthropic vehicle, we see a considerable increased use in recent years. The vast majority of DAFs (81%) were opened after 2010, and over 25% of DAFs were opened after 2020 according to the most recent research. Most DAF accounts (97%) were advised by individuals or families.
Contribution amounts show that DAFs are a mid-range philanthropic vehicle, accommodating contributions larger than typical household donations yet smaller than those establishing private foundations:
38% of contributions fell within the $10,000 to $49,999 range.
15% of contributions were in the $50,000 to $99,999 range.
19% of contributions were within the $100,000 to $499,999 range.

Around 36% of active DAFs disbursed yearly grants ranging from $10,000 to $50,000, the most common grant range.
Grantmaking from DAFs is spread relatively evenly throughout the year—only 32% of grant funding occurs in the fourth quarter. In contrast, the fourth quarter of the year accounts for 57% of all funds contributed into DAFs. Grants over $50,000 (considered a major gift by many organizations) are distributed more evenly throughout the year than grants under $50,000, which were more common at year-end.

Donor Motivation & Trust
Given what we think are downward donation trends in the U.S., we continue to explore whether we see an overall indication of shifts in attitudes around supporting those in need, or growing mistrust of organizations and entities that are part of the social sector. Our hypothesis is that while polarization might negatively impact giving, the act of giving might offer important clues about how we reduce that polarization. The Giving Bridge is a complex multi-lane highway that still has much to teach us.
In our global attitudinal data, we see people have a strong and consistent inclination to give and help those in need.
In countries we survey the vast majority (>=74%) of people in all countries feel that everyone has a responsibility to give back and help those in need.
Across countries surveyed, people are far less likely to say they give out of feelings of guilt (other than in India, where 68% respondents say they give out of guilt).
In the USA, the above results from our Global Omnibus Survey are supported by data from our GivingPulse survey, which indicates that enjoying giving to nonprofits and feeling that everyone has a responsibility to give back and help those in need are not in decline, either amongst respondents in general or amongst nonprofit donors.
Our data also shows that formal nonprofit organizations are generally trusted, and feelings of trust in that work are strongly associated with inclination to give, with the majority of respondents in all countries reporting generally trusting nonprofits and the services they provide. Levels of trust in nonprofits are highest in India (77%).
In some other studies, however, declining trust in nonprofits is being observed, particularly in the U.S. The fourth annual 2023 Independent Sector Trust in Civil Society report found that only 52 percent of Americans say they trust nonprofits to do what is right today, down a statistically significant 4 percentage points from last year, the largest drop since they began their annual survey. Over the same period, trust in philanthropy held steady at 34 percent, but distrust in philanthropy increased 5 points to 26 percent. This report also found that trust is higher for small and local nonprofits, that trust is highest among those reporting their finances are good, and that messages that talk about values rather than data points are effective at building trust.

In the discussion about trust in the nonprofit sector, we think more work needs to be done. If, in fact, trust is in decline, there is a need to understand whether this is related to specific feelings about the nonprofit sector, or more generally about people’s feelings of trust in societal institutions. Those who give report trust in nonprofits at much higher levels than their counterparts (by at least +10 percentage points), no matter what, how, or to whom they give.
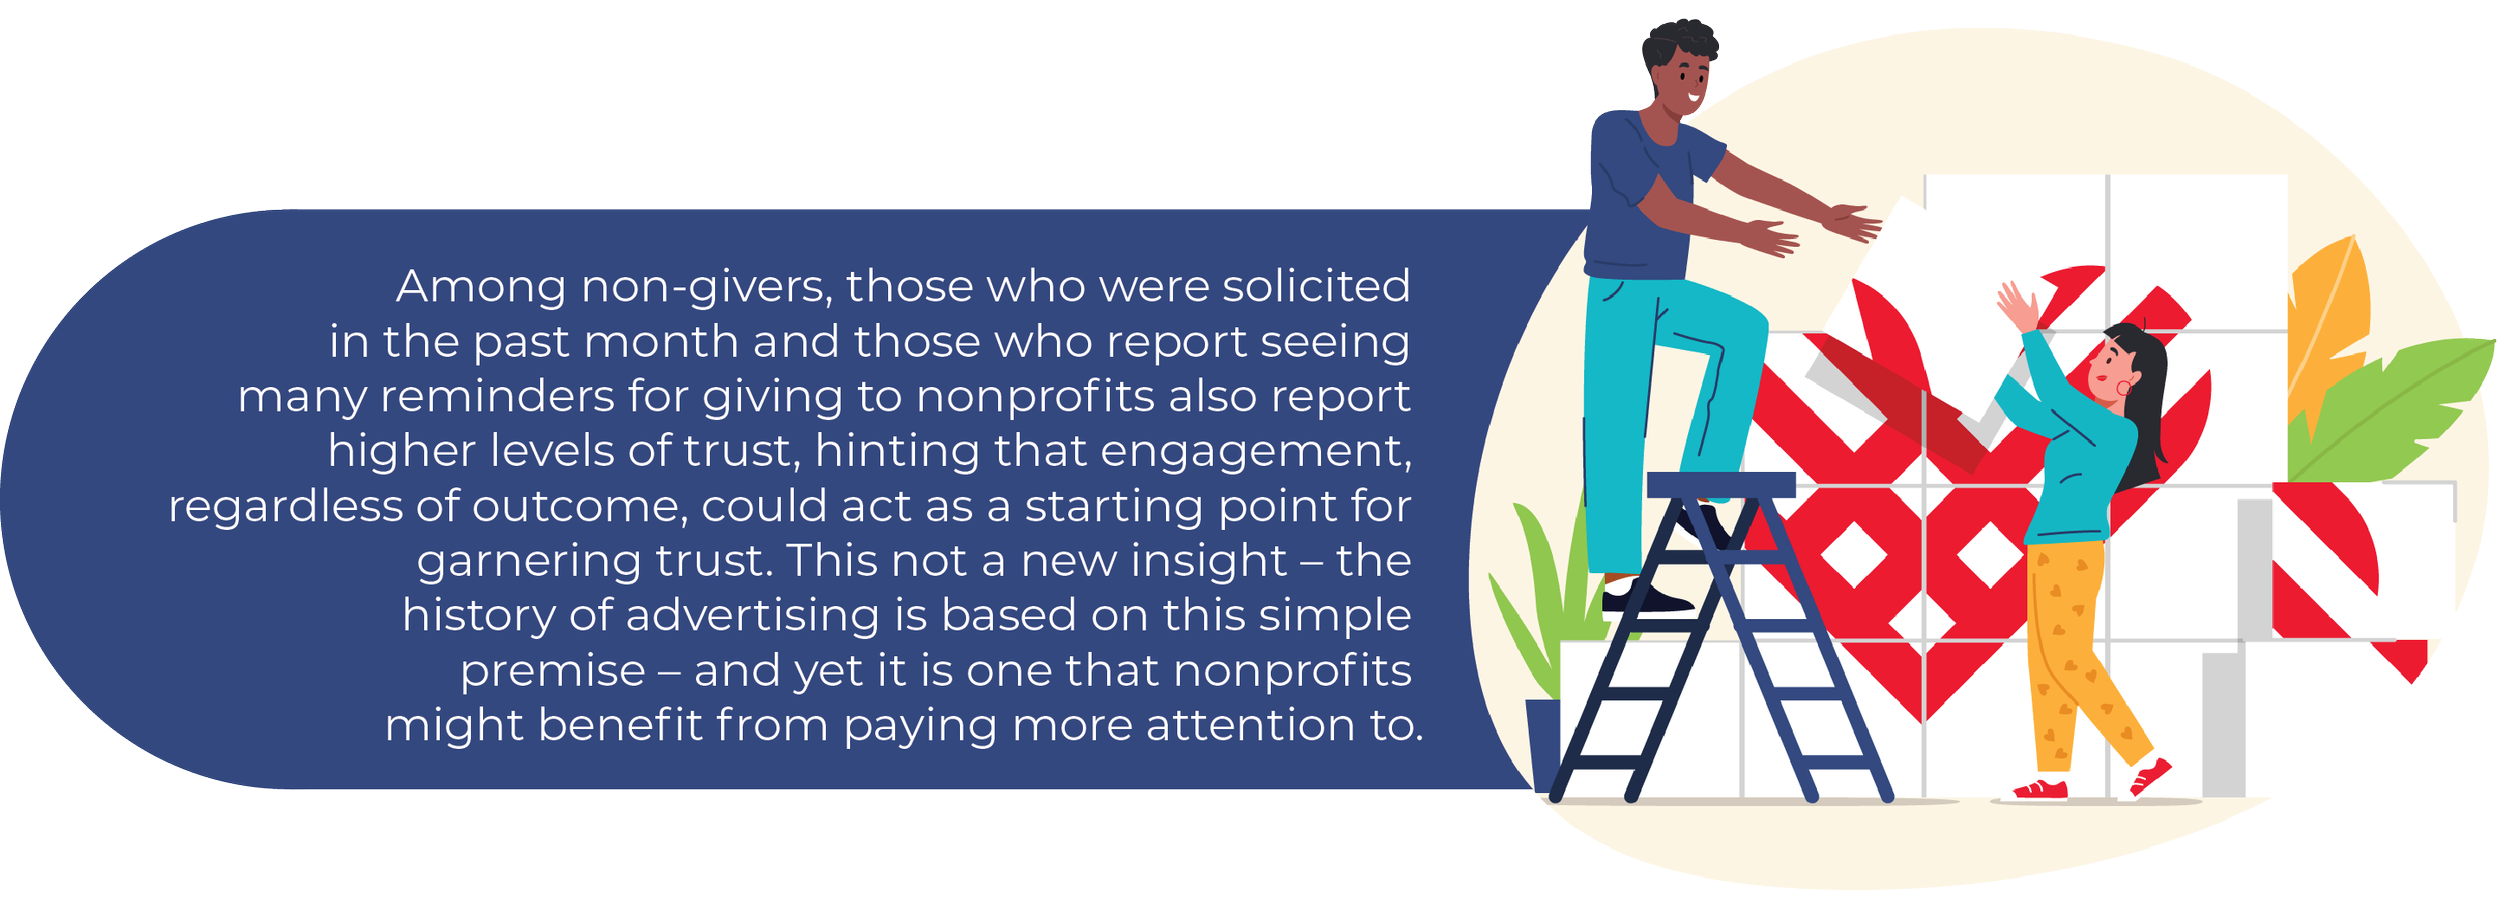
Optimizing Solicitation: Who to Ask and How Often to Ask Them?
(USA only) GivingTuesday continues to deliver the most significant annual spike in donor acquisition in the USA.

On a more holistic level, we also observe shifts in the GivingPulse generosity profiles that would suggest that those who are typically less active in the giving ecosystem are mobilized during the year-end giving season due to this increased engagement. Based on the latest GivingPulse results, it is estimated that an additional 7% of respondents would have responded generously to solicitation if they had been asked recently. This represents an untapped generosity market that is ready to give more if asked more frequently. Find out more about this group in our Q1 2024 report². If people truly did not trust nonprofits, we think we would see very different signals in response to the increased outreach that regularly takes place on that day. We are convinced that people want to give, and they do give. However, our weekly GivingPulse survey, which tracks people’s attitudes and behaviors around giving, suggests that many demographic segments of the population simply aren’t being asked to donate (or asked enough).
² We use year-to-date data (YTD) for GivingPulse. Because of its weekly nature, the data is available and accurate up to a week before the current one. We do not use YTD for FEP or any other sources in this report because their data is only available and accurate months later. That’s why we refer to YTD in GivingPulse and not with FEP or any other projects.

29% of Americans in 2023 had been solicited in the week prior to being surveyed.
40% of Americans in 2023 who had been solicited within the past week responded with generosity. In many cases, the types of people who are asked more frequently are also those who typically respond readily to solicitation. However, the following subgroups were solicited at or below the population rate (29%), while also being more likely to respond with generosity if solicited.

-
People under 30 were solicited at or below the population rate, while also being more likely to respond with generosity if solicited:
44% responded with a donation when solicited
48% of those with middle income ($50-100K household) gave
59% of individuals with high disposable income (>$10K) donated
-
People who are somewhat religious and employed full-time were solicited at or below the population rate, while also being more likely to respond with generosity if solicited:
45% responded with a donation when solicited
-
People with lower income were solicited at or below the population rate, while also being more likely to respond with generosity if solicited:
52% of individuals with high disposable income (>$10K) donate
46% of those who are highly prosocial gave
-
These subgroups under both genders were solicited at or below the population rate, while also being more likely to respond with generosity if solicited:
44% of women who are employed full-time gave
49% of men under the age of 30 donated
Men under 30 specifically stand out as a group who are under solicited but report that they want/intend to give more money to charity. Amongst men under 30, 26% have been solicited in the past week, but 36% report intending to give more money in the next year.


Givers Are Ready to Give More
In 2023, 41% of US respondents say they gave money to a registered charity. From the GivingPulse dataset, we observe that about half of those who recently gave money to a nonprofit reported that they intended to give about the same amount in the following year, while 31% said that they intended to give somewhat or much higher. Among people who had not recently given money to charity, only 18% reported intending to give more next year – people who already give money to charity are more likely to report intending to give more in the future.
We also found that:
Among recurring monetary donors (those who give automatically from their credit card/bank account each month), 41% reported intending to give more next year.
Among those who give automatically from their paycheque, 48% reported intending to give more.
Among nonprofit donors, 33% report recently supporting a new organization or group. Both recurring donors and those who give regularly from their paycheque were more likely to recently support a new group than those who did not give recurring/regularly (38% of recurring donors, and 49% of those who gave from their paycheque) – people who give money in a regular/recurring ongoing manner don’t just stick to the same causes, they are also likely to branch out and start supporting new groups.
42% of respondents overall report that they likely could afford to give more than they already do. Among recurring donors, 66% report that they could afford to give more, and 74% of those who have given automatically from their paycheque report that they could afford to give more.
Already engaged monetary donors are much more likely to see themselves as being able to afford to give more than those that are unengaged or potentially new/one-time givers. Additionally, many people who say that they could afford to give more do not report intending to give more, so these people are potential targets for increased engagement.

What Our Findings Mean for Nonprofit Audiences
We see opportunities for nonprofits to engage their current supporters more – especially recurring donors. These recurring donors may, if approached with the right message and at the right time, be eager to give more. Those that develop strategies for their recurring donors have opportunities to grow giving in that segment.
We see strong signals that many people who aren’t being solicited are, in fact, open to giving. Capitalizing on this potential requires a concerted effort to reach a broader and more representative coalition of supporters.
We think that reaching unsolicited populations may be part of a larger effort needed to democratize giving, and to help redress the imbalance of power that results from nonprofit organizations focusing primarily or even exclusively on well-off segments of the population for financial support. By including more people closer to issues that we’re addressing in the giving ecosystem, we’re creating better conditions for a more responsive, relevant and accountable nonprofit sector.
We think emerging evidence indicates that messages around giving out of guilt don’t resonate as much as messages that connect people to a cause or issue and highlight the value of their contributions.
Nonprofits should use this data to revisit their long-term strategies around donor and community engagement. We’ll be contributing to discussion around potential solutions through work with research, data and community partners.

Funders supporting the nonprofit sector need to support experimentation: planning to reach new audiences, identifying and targeting new supporters, and developing messaging strategies and tactics that will help nonprofits better unlock monetary support. Much of what will be tried may not work at first– but that learning will be essential to future success. Because what we already know is that the same old is no longer working.
Beyond Money:
How We Show Up for Each Other
Giving in Multiple Ways
This year’s findings echo what we reported in last year’s Lookback. Large numbers of people who give (money, items or time) reported doing all three in each of the countries we surveyed.
We continue to believe it’s important to highlight the multidimensional aspect of giving across the world. Whereas previous reports observed a rise in dedicated giving we see few notable shifts this year.
As was the case with last year, we consistently found the most generosity overall in less wealthy countries in our surveys, particularly for non-monetary giving: in our Global Omnibus Survey the US, Great Britain, and Canada showed the lowest rates of giving items and volunteering. While as was the case last year, and as is also noted in other comparative surveys on giving – such as The Charities Aid Foundation’s 2023 Giving Index, which has measured several types of global giving behaviors since 2010 - Kenya stands out for having the largest number of people who give in the most ways.
The biggest gaps in popularity of giving time and money overall are in Great Britain, USA, and Canada, where giving money is 15-17 percentage points more frequently reported than volunteering. In Kenya, the two behaviors occur at the same frequency. In Mexico, volunteering is more popular than giving money by 5 percentage points.

Global Giving by Gift Type (Global Omnibus Survey, 2023)
Gave Money | Gave Items | Volunteered
% of Americans who have given money, items, and/or time by specific giving type


Project Snapshot
World Giving Library
The World Giving Library project, a joint endeavor between the National Philanthropic Trust and GivingTuesday, seeks to assemble and democratize a comprehensive insight into the diverse global philanthropic traditions and prominent figures. Our chief goal is to highlight the inherent cultural richness and capture the great diversity in giving behaviors around the world.
The forthcoming website will house the most comprehensive web resource on generosity practices and traditions to date, offering a robust taxonomy of giving. This platform encourages users to delve into and admire the wide-ranging practices of global generosity. Currently, the project has amassed a collection of over 200 articles, crafted by a mix of scholars, consultants, and contributors from our network.
Through this truly collaborative project, we aim to ignite engagement and stimulate generosity globally. In the African continent, we’ve partnered with TrustAfrica, a pan African Foundation to explore the diversity of African giving traditions in partnership with researchers and practitioners from across the region. This pilot subproject will source and collate 20 articles covering different aspects of African generosity, particularly on indigenous narratives, practices, and traditions. It will serve as a basis for Giving Tuesday exploring further partnerships in other geographic regions to highlight giving narratives.

Volunteering Around The World
In this year’s global surveys, we were excited to observe a promising trend – wherever we look, participation in volunteerism is stable or increasing.
Across nearly all countries we surveyed, we saw increasing rates of overall volunteerism: Canada (+5%), Kenya (+5%), Mexico (+7%), U.S. (+7%), and U.K. (+7%), and stability or very slight declines in Brazil and India.
Overall in 2023, volunteering for individuals was the most commonly reported type of volunteering amongst volunteers (59%). 50% of people reported volunteering for registered nonprofits, and 48% reported volunteering for informal groups.
Volunteers support different types of recipients (formal, organizations, informal organizations, or individuals) in different countries. In most countries, large numbers of people volunteer across all recipient types. However, in some countries (namely Kenya and Mexico) we saw large shifts towards volunteering with formal organizations.
In all countries except Great Britain, volunteering for individuals is the most common form of volunteering. In Great Britain, volunteering for registered organizations is the most common form of volunteering (63% of volunteers volunteered for a registered organization, compared with 57% for informal groups and 56% for individuals).
Volunteering by Recipient Type (Global Omnibus Survey, 2023)
Registered Organizations | Unregistered Groups | Individuals


Demographic patterns in volunteerism vary by country, but in most countries (except for Canada and Mexico) volunteerism increases steadily with increased income.

In Great Britain the margin in volunteering rate between low-medium income groups and the highest income group is the largest of any country (28-30% volunteering in low/medium groups, 48% volunteering in high income group; +18-20%).

Brazil’s trends vary by recipient type. Volunteering for registered nonprofits is most common among the lowest income group and decreases in popularity as income increases.


In Canada and Mexico, the overall volunteer rate is highest in the low-income group.
In Canada, the rates of volunteering for registered nonprofits are more similar between income groups than for informal volunteering, where participation within the low-income group is much higher.
We continue to observe stronger volunteerism participation rates among younger generations in most countries in our Global Omnibus Survey.


In the US, volunteerism is slightly more popular among Millennials (56% volunteering) than Gen-Z (53%)
In Canada, Gen-Z is much more active in volunteering than any other generation, with 58% of Gen-Z volunteering compared with 30-37% of any other generation.
In all countries, volunteering for registered charities is most popular in Gen-Z. And in nearly all countries, volunteerism decreases across generations as age increases, and volunteering is most commonly reported among members of Gen-Z.

What Our Findings Mean for Nonprofit Audiences
We continue to see opportunities for nonprofit organizations to find new ways to invite people to express support for their causes, organizations and communities. Remember – giving behaviors aren’t cannibalistic. On the contrary, more entry points to your mission likely means more engagement, more resilience and more impact.
The continuing downturn in donation dollars coming from large donors tends to encourage even more focus on competing for them, at the expense of diversifying donor bases. This will continue to lead to a downward spiral until we collectively embrace more of the giving community.
Volunteerism is strongly correlated with giving, We think nonprofits should expand their fundraising activities to include greater opportunities to engage potential donors through volunteering, which is not just a way to deliver on programming goals, but can also be a key to growing your donor base and achieving long-term financial stability.

Ultimately, distinguishing between fundraising, programming and engagement activities may be less useful than seeing them as complementary activities, each an aspect of The Giving Bridge.
Where We’re Going
At the GivingTuesday Data Commons
The GivingTuesday Data Commons continues to grow its efforts to map the global giving ecosystem in partnership with a wide range of other groups and organizations. Needless to say this includes our efforts to track the massive global impact ($3.1 billion in 2023) of Giving Tuesday itself, but also extends far beyond this metric to encompass a wide variety of collaborative research projects on how generosity manifests around the world.
In the coming year, we hope to work on the following needs in service of the global social sector:
We continue to expand data collection on peoples’ attitudes and behavior around generosity. Drawing on our Global Omnibus Survey and GivingPulse, we are exploring opportunities to adapt surveys on generous behaviors to more local contexts, to give local stakeholders a more comprehensive view of trends related to giving throughout the year.
We continue to explore opportunities to work with data providers who support the giving economy to collaborate on shared research initiatives to better enable sector stakeholders to gain a more accurate and granular understanding of trends, challenges and opportunities.
We are growing our ability to support testing and experimentation with nonprofit organizations and intermediaries. Building on our Growing Generosity in Florida report, we are working with the Jessie Ball DuPont Fund and the Florida nonprofit Alliance to support testing of messages and approaches to segment and target current and potential supporters.
We are developing new tools and partnerships (such as our pilot project with Candid and Network for Good) to help the social sector map the broader giving ecosystem, tracing where money and support comes from individuals and institutions, how it flows into organizations and causes, and across which geographies.
We are exploring how to better support the use of global research assets (like ours) among nonprofit actors. To that end, we are identifying how to support translating research findings into practice, using evidence to inform testing and experimentation on engaging cause supporters.
What we've been working on:
LATIN AMERICA AND THE CARIBBEAN HUB’S LAC GENEROSITY REPORT
GivingTuesday’s LAC Hub is currently in the process of preparing its inaugural LAC Generosity report. This comprehensive study will spotlight existing data on charitable giving and philanthropy within the region, with a particular emphasis on countries where the movement holds a presence. The LAC Generosity Report marks the beginning of a series of research initiatives planned by the Hub, aiming to delve into the patterns of generosity among the people living in the region, while also bolstering the region’s philanthropic framework.

COMMUNITY RESEARCH COLLECTIVE
GivingTuesday Communities have long sought research driven insights to help their organisations fundraise more effectively and to increase their impact. The Community Research Collaborative is a project that seeks to leverage this peer-reviewed research and deliver testing-suggestions to community leaders to implement. We see the benefit of such an exercise as being two-fold. One, that the communities in our network have tangible suggestions that they can execute - with the understanding that although research-backed, the theories might not deliver similar results, and two, that academics might derive value from their research being tested in the real world which in turn might help them further refine their theories.

990 PROJECT
GivingTuesday firmly believes that the public data submitted to the IRS via Form 990 by tax-exempt nonprofit and charitable organizations is an essential resource for conducting research and promoting transparency in the social sector. Given its value to sector stakeholders and following the IRS announcement that the Form 990 series data would no longer be updated on Amazon Web Services (AWS), GivingTuesday and its partners took it upon themselves to make clean, research-ready form 990 data readily available as a public good to all sector stakeholders. We have built and launched a data and technical infrastructure that will lower existing barriers to the use of this dataset and enable more research and innovation, ultimately improving outcomes for sector beneficiaries.
GROWING GENEROSITY IN FLORIDA
In collaboration with the Jessie Ball DuPont Fund and the Florida Nonprofit Alliance, GivingTuesday researched the latest giving trends in the state of Florida in 2023. The Growing Generosity in Florida report provides actionable insights for Florida nonprofit organizations, donors, and policymakers about the dynamics of individual givers across the state of Florida in the United States. In this study, we focused exclusively on younger people (adults aged 18-45) to generate insights about how to best attract and retain them as lifelong givers. The goal was to better understand givers throughout Florida, using this knowledge to guide strategies and generate ideas to ultimately increase giving in Florida. The findings of the research revealed direct implications for how nonprofits can reach their donor audiences and better understand divergent patterns of attitudes and behaviors among Floridians. Building on these implications, GivingTuesday’s research team recommended initial strategies for their fundraising outreach, including segmentation of their target audiences and optimization of their messaging.

As a way to expand on these recommendations, the GivingTuesday team is embarking on the next phase of this research to deliver actionable insights to Florida nonprofits. In this next phase, we are looking to give the opportunity for Florida nonprofits to voice their fundraising challenges and express concerns about reaching donors effectively then use these valuable insights to design quantitative experiments. These experiments will test different approaches to better fundraising methods for nonprofits. The results will help us determine the feasibility and acceptability of these experiments among implementing organizations and develop recommendations on larger-scale quantitative study of interventions for growing giving behaviors in Florida.
The GivingTuesday Data Commons also leads a number of collaborative working groups that create a shared approach to research and an opportunity for giving platforms, researchers, academics, data scientists, and practitioners to collaborate on the following research themes:
Crisis + Generosity
This global working group explores how
generosity can be mobilized during times of crisis and how responses from civil society can be resourceful and creative. Specifically, the group is interested in how to rapidly identify needs
on the ground and the networks and players best equipped to respond at the outset of a crisis, the kind of data infrastructure needed to understand these networks, and how predictive technology can
produce the data needed to get ahead of crises.
Workplace Giving
Supported by Schwab Charitable, the Workplace Giving Working Group brings together leaders from a wide range of organizations seeking to bring more generosity into the workplace. Members of this group convene to identify methods for amplifying the effect of workplace giving campaigns, providing more agency to employees, and ultimately creating better outcomes for beneficiaries, employees, and employers alike.
Crowdfunding + Online Giving
This Working Group focuses on online giving, fundraiser and donor behavior, product innovations, customer and partner insights, and specific
data science methodologies to uncover key motivators for how and why people contribute to crowdfunding campaigns and to uncover trends in online giving.
Generosity AI
The Generosity AI Working Group is a cross-sector collaboration between practitioners in tech, academics, and the social sector who are exploring ways that artificial intelligence (AI) can be used to advance missions and grow generosity at scale. This working group will explore the role of knowledge-sharing platforms, learning networks, and communities of practice in accelerating AI adoption for social good. It will also identify strategies to address issues related to resource constraints, governance, data sharing, and equity in collaborative AI projects.
GET INVOLVED
Appendix
Explanation of arriving at our estimate of $192 billion given by individuals outside the US to charitable organizations worldwide.
We found that there was no detailed global estimate of the total amount given to nonprofits from individuals worldwide, so we used existing data to build our own model based on the CAF World Giving Index (WGI 2023) and IU’s Global Philanthropy Environment Index (GPEI, 2022). We adjusted using per-capita income and interpolated missing data using neighboring countries to arrive at a global estimate of $192 billion annually given to nonprofits outside the USA. CAF’s WGI provided us with estimates on the percent of the public that gives money to charity for 120 countries, using an online survey. IU’s GPEI provided us with a 1-5 score for 90 countries, grouped into 14 world regions. Because WGI doesn’t give an estimate on the amounts donated by people in various countries, we had to estimate this based on a series of assumptions, shown below.
We converted the percent who gave from the WGI into a percent of GDP, using a CAF 2016 survey of 22 countries and a related OECD study, which provide a range of most-likely values, from 0.0% of GDP to a max of 0.8% of GDP. We assumed the US was an outlier, at 1.44% of GDP. We assumed that a population’s generosity in the WGI was proportional to that country’s share of GDP contributed to organizations. We then normalized all countries within this range, and multiplied by the GDP of each respective country to get a 2017-equivalent dollar total. We used 2017 GDP estimates because the percent of GDPs in the ground-truth studies were based on economies at that time.
For interpolating the remaining countries, we used nearby countries whose WGI was available, or the regional averages for GPEI.
To reflect the absence or presence of an enabling environment, we converted GPEI scores to weights by normalizing with a ceiling of 1.0, where countries with a score of 3.5 or higher earned a 1.0. The average of the 14 regions was 3.8, with 3.17 being the lowest. These weights imply that most countries are “free enough” for people to support local philanthropy, but that a few governments are hostile to nonprofits, and this depresses the amounts raised. North Korea’s weight was set to 0 on the assumption that the government outlaws the existence of non-governmental groups, and “civil society” organizing in general. Most countries fell in the 0.8 to 1.0 range, with the exceptions being Venezuela (0.54), Iran (0.57) and Egypt (0.67).
Poorer countries (those with a higher proportion living under the global poverty line) are likely to raise a little less, and richer countries a little more per person, so we adjusted these values in the range of 80% to 120% of what was predicted by WGI percents using per-capita income. If a country’s per-capita income exceeded the global mean of $20,645, the amount raised was scaled upwards to a ceiling of 120% (i.e. Luxemburg), or scaled downwards to 80% (Burundi).
We excluded 26 countries with a population less than 50,000 (628,000 people in all), as there was scant economic data available for many of them.
Multiplying the dollar amounts per country by these two weights (GPEI and income) resulted in an adjusted total of $192.2 billion.
How much do our assumptions and adjustments affect the estimate?
The unweighted total (ignoring GPEI and relative incomes) was $219.8 billion.
Ignoring the countries for which we have no WGI data, and only considering the 120 WGI countries gives a total of $183.3 billion (or $210.1 billion unweighted).
Ignoring the relative income of countries gives $208.4 billion.
Broadly speaking, variance in the results of our model with differing assumptions provides estimates that range from $183 to $220 billion, with $192 being our best guess based on all the available information. Because this total is based on the most reliable studies, which date back to 2017, those wanting to extrapolate a less conservative estimate might want to consider that the GDP of Earth in 2017 was $81.5 trillion, and is expected to increase to $109.7 trillion in 2024. If we assume that generosity increases in tandem with economic growth (but the relative generosity doesn’t change over time), a 2024 estimate would be $258.7 billion (a 34% increase).
We’d like to thank Bill Savedoff (SocialInsight.org) for reality-checking these calculations.


